

Daily and monthly sales analytical report
Sales Report (/admin/reports/sales)
Accurate financial data helps the manager understand the restaurant's real performance and make smart decisions about staffing and supplies.
Key Performance Indicators (KPIs):
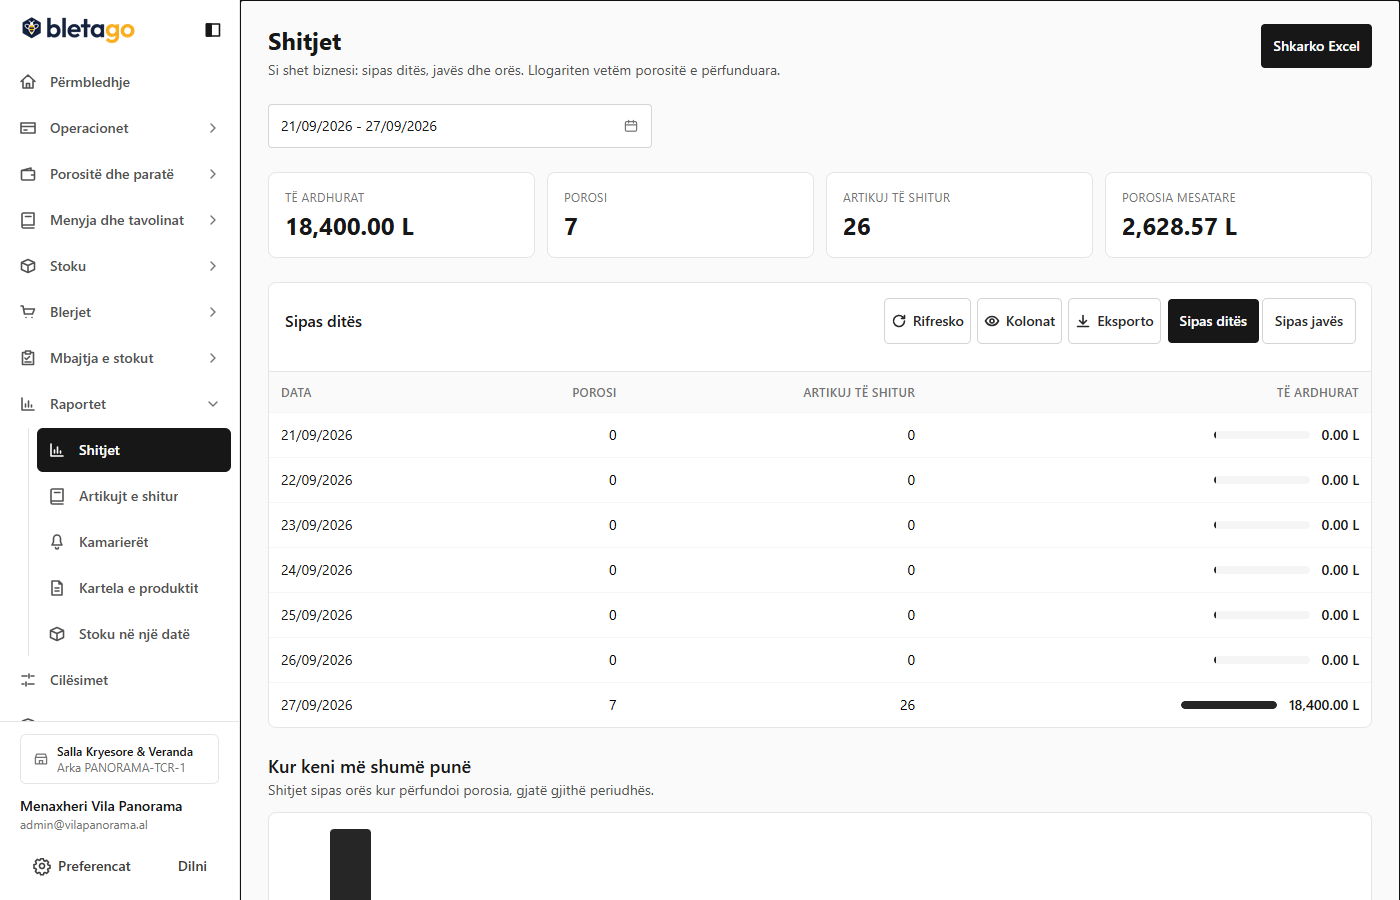
At the top of the report, the immediate figures for the selected period are displayed:
- Gross Turnover: Total amount of invoices issued.
- Net Turnover (excluding VAT): The entity's real income.
- VAT Collected: The mandatory amount to be paid in taxes.
- Total Number of Tables / Orders: How many customers were served.
- Average Ticket Value:
Xhiroja / Numri i Porosive.
Detailed Charts:
- Sales by Hours of Day: Identifies peak hours (e.g. 1:00 PM - 3:00 PM for lunch and 8:00 PM - 11:00 PM for dinner).
- Sales by Category: The percentage of revenue that comes from main courses, pizza, salads or drinks.
- Top Sellers: List of the 10 most popular dishes of customers.